2. Data requirements#
All the data used in this project are open-source and publicly available. To perform accessibility analyses and to estimate the disruption caused by floods, the following essential data are required:
Dataset |
Description |
Required Attributes |
Other Attributes |
Format |
Example |
|---|---|---|---|---|---|
Health facilities |
This represents the supply-location of health infrastracture |
Location (e.g., lat, lon) |
Type of health facility (e.g, referral, primary etc), number of beds |
.csv or .xlsx |
|
Population |
This represents the clients/demand |
Location (e.g., gridded population) |
Time (e.g., census year) |
.tif, .nc |
|
Travel Friction Surface |
Raster layer with modelled travel time using road network and other layers |
N/A |
type of motorization (e.g., foot or car) |
.tif |
|
Road network |
Road infrastructure required to travel |
N/A |
Road types (e.g., primary, bridges) |
.osm.pbf, .shp |
|
Flood maps |
Layer representing flood hazard or flooded area |
Return Period (RP), Extent |
Time (e.g., year), Scenario, Flood Depth |
.tif, .shp, .nc |
Let’s describe in detail the dataset used:
Health Facilities#
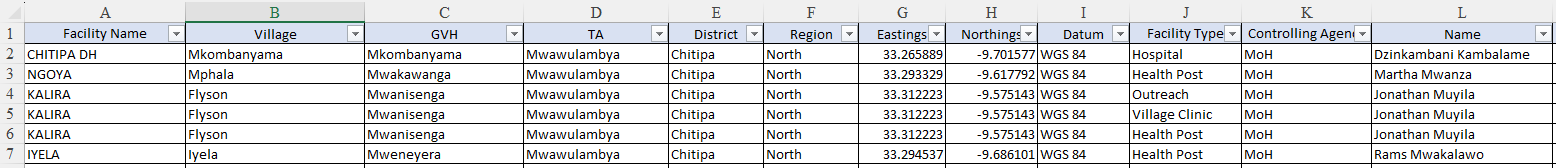
Health facilities datasets come in the format of .csv (or similar) files as, in their simplest terms, the only required information needed is their geographical positioning represented by Longitude and Latitude coordinates and an identification name for the facility. Additional information regarding the type of facility (whether an hospital or a clinic), the number of beds and the specialization are somewhat facultative, despite they could increase the reliability of the assessment. These information are formatted in separate columns as shown below, with rows representing each health facility.
Population#
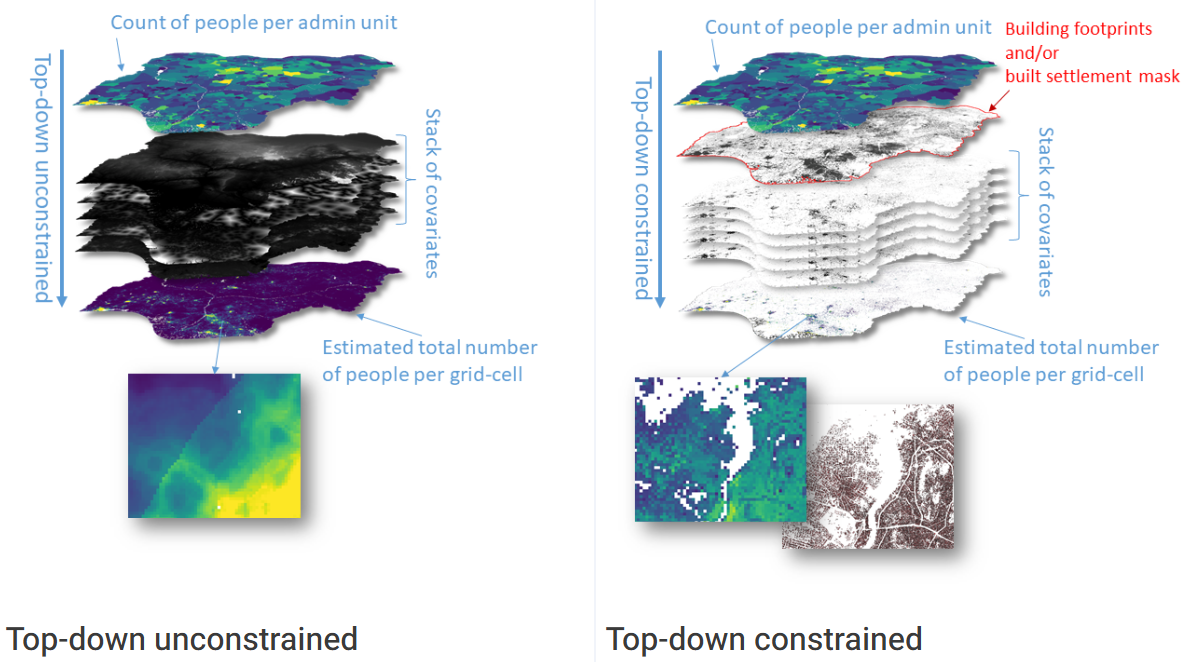
Population datasets are gridded representation of either population count (N° of people living within each grid-cell) or population density (N° of people living in the cell/pixel area). Being raster datasets, they are substantially a 2D (nlat*nlon) grid, usually formatted as GeoTiff files (.tif), but could also be stored in other grid-based formats, like NetCDF (.nc). The data represented are referring to a specific census year (e.g., 2020) and generally are built from people counts per administrative units using a top-down approach, ultimately generating a dataset of a specific resolution (e.g. 100m, 250m or 1km) and extent (global or country). In this project, WorldPop population counts data are used, specifically the UN-adjusted, unconstrained ones, meaning data are generated using a machine-learning method over all land-areas and by adjusting the overall estimations with UN official population estimates (see figure below).
An extensive comparison of the effect of choosing different population datasets when assessing healthcare accessibility is presented in [].
Travel Friction surface#
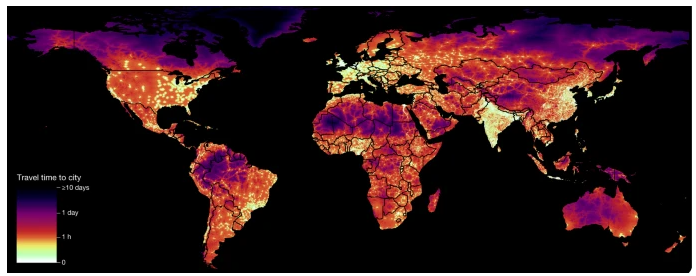
One alternative to perform accessibility analysis relies on the use of raster data. Travel surfaces are raster layers representing the time required to cross a grid-cell either by foot or by means of motorized transportation, based on landscape characteristics and transportation infrastructure. This project uses the 1km resolution motorized friction surfaces developed by the Malaria Atlas Project, which are freely accessible and shared as GeoTiff files (.tif). Friction surfaces are useful as they allow for a faster, pixel-based computation of accessibility metrics compared to the usage of a road network. An example is shown below, representing the global map of travel time to cities [] and [].
Road Network#
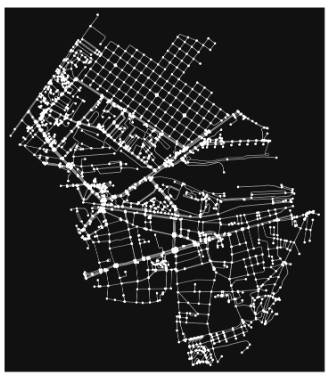
Another approach for estimating accessibility parameters relies on the use of vectorized data. Therefore, a road network is needed in order to build a graph (see below an example) that connects the origin points of the map (each population grid-cell) to the destinations of their travel (in this case the health facilities). The road network is shared as either a shapefile (.shp) containing the vector geometries representing the streets, or in their native OSM data file (.osm.pbf). This project relies on the OpenStreetMap (OSM) shapefile of the road network in order to construct some specific indicators, which in Python is opened and managed with the help of the GeoPandas library. Geopandas relies on the same tabular structure of the Pandas library, handling GeoDataFrame data by storing the geographic and geometric information as a separate Geometry column, each one composed by a Shapely object.
Flood Maps#
Flood maps are needed in order to model the disruption caused by flood events on either the travel friction surface or on the road network, consequently impacting the health infrastructures accessibility. For this purpose there could be used either hazard maps, representing the area impacted in the event of a flood of a specific statistical occurrence probability or climate scenario, or a flood extent map of a real event, as those produced during and after natural disasters. Being raster datasets, the minimal information needed in order to perfrom an accessibility analysis is their spatial extent, usually represented as binary data (e.g., 0 and 1), representing flooded and unflooded surfaces. In the case of hazard maps, additional useful information is about the probability of occurrence expressed in Return Periods (RP), the flood depth (in meters), the type of flood (coastal, riverine of pluvial) and future climate scenario if considered in the generation of the dataset itself.
Please note that FATHOM flood hazard maps have been used in this project as The World Bank Group has access to these data, but are not publicly available. As an alternative to FATHOM data, WRI Aqueduct flood hazard maps are one of the most widely used open-source flood hazard maps that can be freely retrieved.